
Three things to take away
What is the outlook for the UK’s trade in goods – and how is the geopolitical and economic landscape impacting growth prospects
What are the key risk areas for firms involved in global commerce in 2024
What can firms engaged with international trade do to mitigate risk and promote growth by tapping into research, diversification, insurance and other financial products
International trade is a cornerstone of the economy for many countries and companies, including the UK. Recent issues affecting global supply chains – including the effects of the Covid-19 pandemic and of Russia’s invasion of Ukraine – have left the UK’s importers and exporters facing a range of challenges, alongside the ongoing impact of Brexit.
The coming years are likely to see governments in the UK, Europe and the rest of the world looking to ensure access to critical goods while navigating trade flow concerns through the filters of evolving post-Brexit rules and relations, geopolitical uncertainty, and near-shoring and onshoring trends.
Introduction
International trade is a key pillar for many companies’ business models and of many countries’ economies.
For businesses operating in the United Kingdom, recent years have seen a unique set of challenges. Alongside issues affecting global supply chains – such as the impacts of the Covid-19 pandemic and of Russia’s invasion of Ukraine – the UK’s importers and exporters have also had to adapt to the impact of Brexit on their operations. New checks on goods at borders have created paperwork and delays, and the end of free movement has contributed to haulier shortages, while new trade deals have done little to open up new markets.
The coming years are likely to see governments across Europe and beyond looking to ensure access to critical goods. Some businesses will benefit from shorter supply chains, but few are likely to be able to insulate themselves from the impact of global events on trade flows.
The UK’s trade in goods
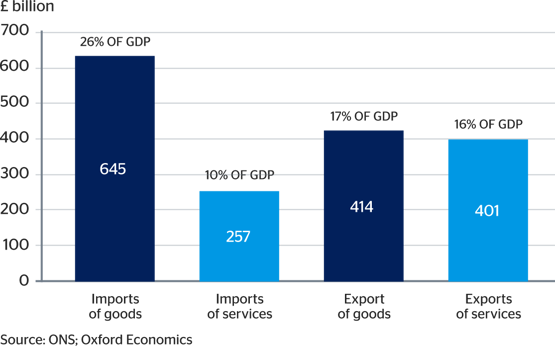
In 2022, the UK imported £645 billion and exported £414 billion of goods (Fig 1). This compares to £257 billion of imports and £401 billion of exports of services. Or to give another sense of scale, the value of goods imported and exported equated to 26% and 17% of UK GDP.
Most manufacturing goods exports are produced by a small number of industries. The latest data suggest that more than half were made by five industries.1 Manufacturers of vehicles, trailers, and semi-trailers were the biggest player, exporting £40.5 billion, which is equivalent to 24% of all manufactured goods exports. They were followed by air and spacecraft manufacturing (£16.4 billion or 10%), basic pharmaceuticals (£9.5 billion or 6%), petroleum and petcoke refining (£8.3 billion or 5%,) and manufacturers of rubber and plastic products (£7.7 billion or 5%).
The manufacturing industry spent around £340.0 billion on imports. By sector, once again auto-manufacturers imported the largest amount—£46.7 billion (14% of total manufacturing imports). Refineries and aircraft manufacturers are second and third, importing £26.4 and £18.4 billion, or 8% and 5% of the total, respectively.
1. UK input-output analytical tables, industry by industry, 27 March 2023.
2. ONS. 2023. Foreign-owned businesses in the UK: business count, turnover and GVA, from the Annual Business Survey 06 July 2023.
One reason for the high level of goods trade is the role of foreign-owned firms—in particular, multinational enterprises with global supply chains. These strengthen international trade as they move goods between their various operations across the world. Foreign-owned business made 53% of total UK manufacturing turnover in 2021.2 In total, foreign-owned manufacturers made a £79 billion contribution to UK GDP, or 44% of the total made by the manufacturing sector.
Fig 1: UK export and imports of goods and services in 2022
Challenges facing firms involved in the trade in goods
Trade in goods requires the physical transportation of goods to and from the UK. This brings with it additional risks, as was illustrated by the coronavirus (Covid-19) pandemic and global supply chain problems which in part reflected problems with transportation.
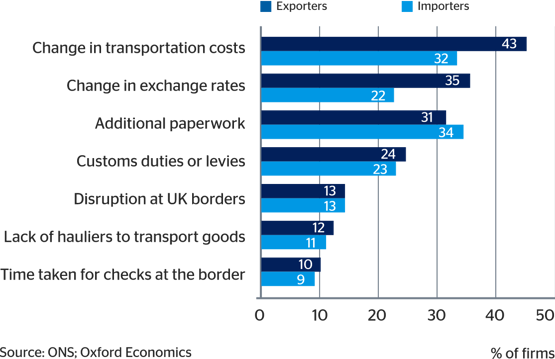
The recent challenges faced by UK manufacturers involved in international trade were captured by a survey by the Office for National Statistics.3 Exporters said risks related to the movements in prices affected them the most, with 43% and 35% reporting that changes in transport costs and exchange rates were the most challenging (Fig. 2).
Tariff barriers (in the form of custom duties and levies) and non-tariff barriers to trade (such as the additional paperwork required, and time taken for border checks since the UK left the European Union) also ranked highly in the list of challenges to overcome. Problems with logistics, such as a shortage of hauliers, were also an issue.
3. ONS. 2023. Business Insights and Conditions Survey data, Wave 87. 27 July 2023.
Fig 2: Did your business experience an increase in any of the following exporting and importing challenges in June 2023, compared with the previous calendar month?
Trade in goods requires the physical transportation of goods to and from the UK. This brings with it additional risks, as was illustrated by the coronavirus (Covid-19) pandemic and global supply chain problems which in part reflected problems with transportation.
The recent challenges faced by UK manufacturers involved in international trade were captured by a survey by the Office for National Statistics.3 Exporters said risks related to the movements in prices affected them the most, with 43% and 35% reporting that changes in transport costs and exchange rates were the most challenging (Fig. 2).
Tariff barriers (in the form of custom duties and levies) and non-tariff barriers to trade (such as the additional paperwork required, and time taken for border checks since the UK left the European Union) also ranked highly in the list of challenges to overcome. Problems with logistics, such as a shortage of hauliers, were also an issue.
3. ONS. 2023. Business Insights and Conditions Survey data, Wave 87. 27 July 2023.
Fig 2: Did your business experience an increase in any of the following exporting and importing challenges in June 2023, compared with the previous calendar month?
Another risk for UK exporters and importers of goods relates to the reliability of their trading partners. Fortunately, the UK exports and imports only a relatively small proportion (0.8% and 1.3%) of its goods to countries that have high levels of institutional and social fragility or are affected by violent conflict as judged by the World Bank’s definition for this year.4
But countries’ situations change constantly. One way we can look at the vulnerability of goods trade is to see what proportion goes to countries that have political differences with the UK. To assess potential issues,5 we use the voting patterns in the United Nation’s General Assembly resolution to deplore the Russian invasion of Ukraine. Only 10% of the UK’s goods exports go to countries that voted against or abstained on the resolution – but 33% of the UK’s goods imports were sourced from countries that voted against or abstained. China and India, which both abstained, are the largest trading partners for both trade flows, but it is more of a potential issue in terms of the supply of imports (23% and 3%, respectively).
4 . The World Bank. 2023. FY24 List of Fragile and Conflict-affected Situations. 10 July 2023.
5. United Nations. 2022. Aggression against Ukraine: resolution/adopted by the General Assembly. Accessed 10 August 2023.
After the Covid pandemic and supply chain crisis, the terms ‘friendshoring’ or ‘allyshoring’ were coined. Both mean only sourcing inputs from countries that are geopolitical allies. While sourcing from and exporting to friendly countries reduces geopolitical risks, it may come with the drawbacks of increasing the costs of imports and restricting the size of potential export markets.
Our central forecast is that the value of goods exported from and imported into the UK will decline by 3.2% and 0.8% in real terms in 2023, reflecting the slowdown in world and UK growth.
Key things to watch
- Evolving post-Brexit rules and relations: Brexit is not as “done” as might be assumed. The relationship between the UK and the EU is likely to evolve in the coming years, and further changes post-Brexit trading rules are probable. Some changes are likely to be pragmatic revisions to processes that will make it easier to move goods into and out of the UK. Others may be more fundamental changes, such as future governments moving to take the UK back into the single market in some form.
- Geopolitics will strike again: Since Russia’s invasion of Ukraine in 2022 took many by surprise, businesses are ever more aware of the potential impact of political crises on global trade, be it via the imposition of sanctions or the need to close entities abroad for reputational reasons. The next big moment might come from one of the world’s well-known simmering tensions or could be a bigger shock. Either way, international trade will be affected.
- Near-shoring and onshoring trends: Partly in response to geopolitical shocks, partly to the pandemic, governments and businesses are looking to move sourcing and production closer to home in the hope of reducing supply chain disruption. As the trend progresses, this will open up new opportunities for diversification.
Macroeconomic risks to the export and import of goods
Our central forecast is that the value of goods exported from and imported into the UK will decline by 3.2% and 0.8% in real terms in 2023, reflecting the slowdown in world and UK growth. Thereafter, we expect the annual growth in goods exports to recover to 1.7% in 2024 and 2.6% in 2025. The recovery in the annual growth in imports of goods is forecast to be more rapid, reaching 2.9% and 2.7%, respectively. This is likely to lead to a deterioration in the visible trade balance.
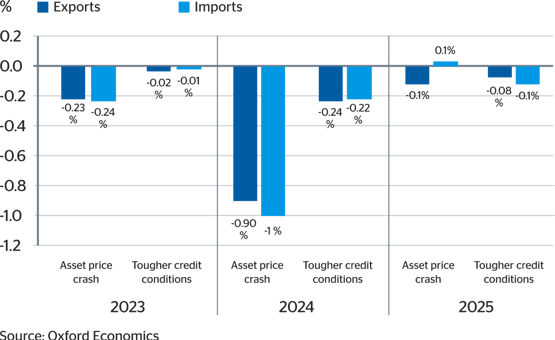
But economic forecasting is difficult and prone to errors as unforeseen events occur. It is worthwhile looking at how the UK’s exports and imports of goods may perform in two more negative macroeconomic scenarios.6 The two are an asset price crash and tighter credit conditions. Both take a toll on the value of exports and imports, particularly in 2024 (Fig. 3).
6. Oxford Economics. 2023. Oxford Economics Global scenarios service. Accessed 10 August 2023.
Economic forecasting is difficult and prone to errors as unforeseen event occur.
Fig 3: Differences in the forecast growth rates of UK exports and imports under two adverse scenarios relative to the base forecast
Our central forecast is that the value of goods exported from and imported into the UK will decline by 3.2% and 0.8% in real terms in 2023, reflecting the slowdown in world and UK growth. Thereafter, we expect the annual growth in goods exports to recover to 1.7% in 2024 and 2.6% in 2025. The recovery in the annual growth in imports of goods is forecast to be more rapid, reaching 2.9% and 2.7%, respectively. This is likely to lead to a deterioration in the visible trade balance.
But economic forecasting is difficult and prone to errors as unforeseen events occur. It is worthwhile looking at how the UK’s exports and imports of goods may perform in two more negative macroeconomic scenarios.6 The two are an asset price crash and tighter credit conditions. Both take a toll on the value of exports and imports, particularly in 2024 (Fig. 3).
6. Oxford Economics. 2023. Oxford Economics Global scenarios service. Accessed 10 August 2023.
Economic forecasting is difficult and prone to errors as unforeseen event occur.
Fig 3: Differences in the forecast growth rates of UK exports and imports under two adverse scenarios relative to the base forecast
Advice for business
The most effective way of minimising the risks involved in international trade is to ensure business activities are insured. Although nowadays shipping processes are quite safe, there is always some degree of risk. Buying insurance coverage is a way of mitigating financial losses in case something goes wrong. This can cover issues such as products damage, theft, and cargo losses.
Another strategy is to carry out market research on current and prospective trade partners. This can help select trade partners. Companies should be informed about the risks surrounding the other party’s business locations, transport routes, potential barriers or major cultural differences that may harm the business. This should also include potential political instability such as civil unrest, terrorism, or changes in government, which can disrupt trade and business activity.
When possible, companies should also try to diversify their export markets and supply chains. This should lower risk from one-off events in particular countries. This diversification should also potentially extend to the modes of transport and transport routes used to get the goods to and from the UK. Contingency planning to prepare for worst-case scenarios, such as alternative sourcing options or backup supply chains, is also a sensible precaution.
Lastly, taking advantage of the products’ financial markets offer to reduce risk can help lower risk. For example, taking hedging positions in financial markets can offset potential losses from adverse movements in exchange rates or commodity prices.
This report has been developed for QBE by Control Risks and Oxford Economics
This report has been developed for QBE by Control Risks and Oxford Economics
Building Supply Chain Resilience
Understand and manage risk in your supply chain
More like this
Sign-up to be notified about future articles from the Sector Resilience Series, and other thoughts, reports or insights from QBE.
Subscribe now